
 Think
about it
Think
about it
Population
growth
Population growth is the
change in population over time for a particular place.
We tend to look at human countries within countries, whose
governments then attempt to manage that change.
However, in today’s globalised world we must also consider Global
patterns in population change.
Over the years
population has
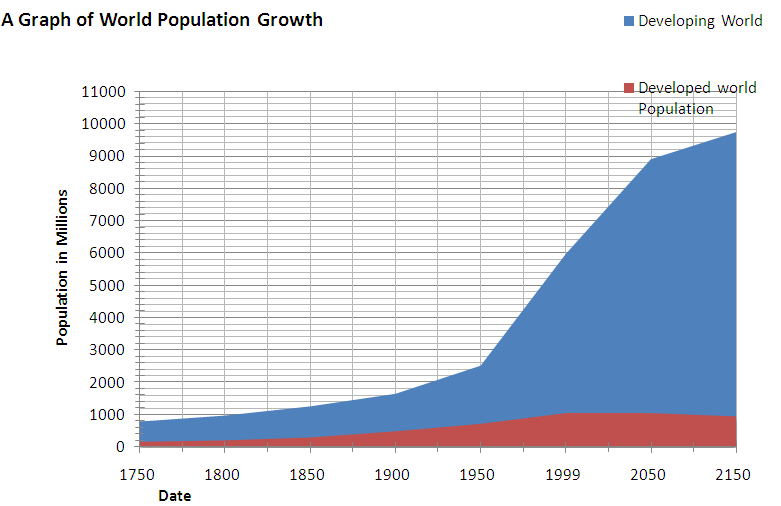
changed dramatically. In 1540 the population
stood at 300 million. In 1750 the population was estimated at 791
million. In 1900 it had again grown to 1.7 billion. By 1950 it had
reached 2.5 billion. More than a 50 % increase in the last 50 years.
Between 1950 and 2000 the population grew to 6.2 billion. It is
predicted in the next 50 years it will double again to almost 12 .5
billion. Problems which arise due to the rapid increase of population
are that of over- crowding, resulting in shortages of food and water,
not enough health care and fewer means of Education. It also decreases
our natural habitat because we destroy woodlands, rain forests, forests
and areas of natural beauty; as we need the space to build houses,
schools and Health Centres. This is the concept of
OVER POPULATION.

This is change in population is known as the J curve graph because of its
shape. It is thought that
the curve will become an S shape as population growth slows down.
This growth is said to be
EXPONENTIAL because
it continually increases over time. It is predicted that growth
will slow down in the future.
This issue ties in with the relationship between population and
resources, will resource exploitation and development be sustainable and
be able to keep up with population growth.
In the future, there are several scenarios that could play out,
from continued extreme exponential growth, to stabilisation and then
possible global population decline.
In 2007 the United Nations Population Division projected that the
world's population will likely exceed 10 billion in 2055. In the future,
world population has been expected to reach a peak of growth, from there
it will decline due to economic reasons, health concerns, land
exhaustion and environmental hazards. According to one report, it is
very likely that the world's population will stop growing before the end
of the 21st century.
The most recent milestone
came in 2012, the day of 7 billion people, and for the near future
global population growth shows no sign of slowing down.
The population has grown by 1
billion in just 12 years
-
find out more on the BBC

Indeed, the time taken to add a billion people has also reduced.
As shown in the table below, the years are the closest
approximates (source)
|
Population size |
Date |
Time to add next billion |
|
1 billion |
1800 |
NA |
|
2 billion |
1927 |
127 |
|
3 billion |
1960 |
43 |
|
4 billion |
1974 |
14 |
|
5 billion |
1987 |
13 |
|
6 billion |
1999 |
12 |
|
7 billion |
2011 |
12 |
Most of the population growth
is found in LEDCs
(Less
Economically Developed Countries) such as China and India. Indeed, these
2 countries alone account for 36% of World population in 2012 whilst
60.3% of the World’s population can be found in Asia and only 10.6% in
Europe! Africa’s population growth is large despite the Aids virus
lowering life expectancy.
There are also clear Geographic patterns as revealed by the map below;

-
Sub Saharan
Africa and many of the World’s LDCs have very rapid
growth rates
-
MEDCs such
as those countries in Western Europe and North America
have slow population growth rates
-
Many LEDCs
and NICs in Asia and South America have reasonable
growth rates but those are falling in many NICs such as
India and Brazil
-
There are
places such as Eastern Europe, Japan and South Africa
where we have population decline.
NATURAL INCREASE, BIRTH AND DEATH RATES
Birth Rate
is the
term used to define the number of babies born every year per 1000 people
in a population.
Death Rate is the term used to define the number of deaths every year
per 1000 people in a population.
Natural increase in a population occurs where Birth rate is greater than
death rate. That is, that there are more births than deaths in that
population in a year.
Natural decrease occurs when death rate is greater than birth rate. This
means that more deaths occur in a population than babies are born so
population numbers decline.
How is the
natural increase found?
Natural
Increase
(per cent)
=
Birth rate -
death rate
10
If birth rate is higher than death rate = Larger Population or a Natural increase in the population size
LEDC'S are more likely to have a higher death rate than MEDC'S due to
illnesses and lack of medical treatment.
The natural increase is given as a percentage, but we must be
cautious. Even % growth that
appear small at say perhaps 2% can yield HUGE changes in population
size. This is also not to be
confused with replacement birth rate, which is 2.1 babies per woman.
Of course, this balance is changed by Migration. If people move
Into a country (Immigrants)
the population will increase. If people leave or Exit
a country (Emigrate) the population could
decrease.