 |
|||||
|
|
|
||||
| Rivers Controlled assessment - 2015 | |||||
| Your controlled
assessment is worth 25% of your final grade. This year's topic is
on: Investigate erosion and/or deposition in a river channel
Content
2000 Words maximum Introduction and methods – 800 words – in CLASSROOM CONTROLLED CONDITIONS Data presentation (tables graphs etc) – in CLASSROOM CONTROLLED CONDITIONS
Analysis, conclusions and evaluation – 1200 words – in EXAM STYLE CONTROLLED CONDITIONS
QUICK LINKS ON THIS PAGE; |
|||||
| Research and theory | Useful documents | Methodology | Location | Presentation of results | Analysis |
|
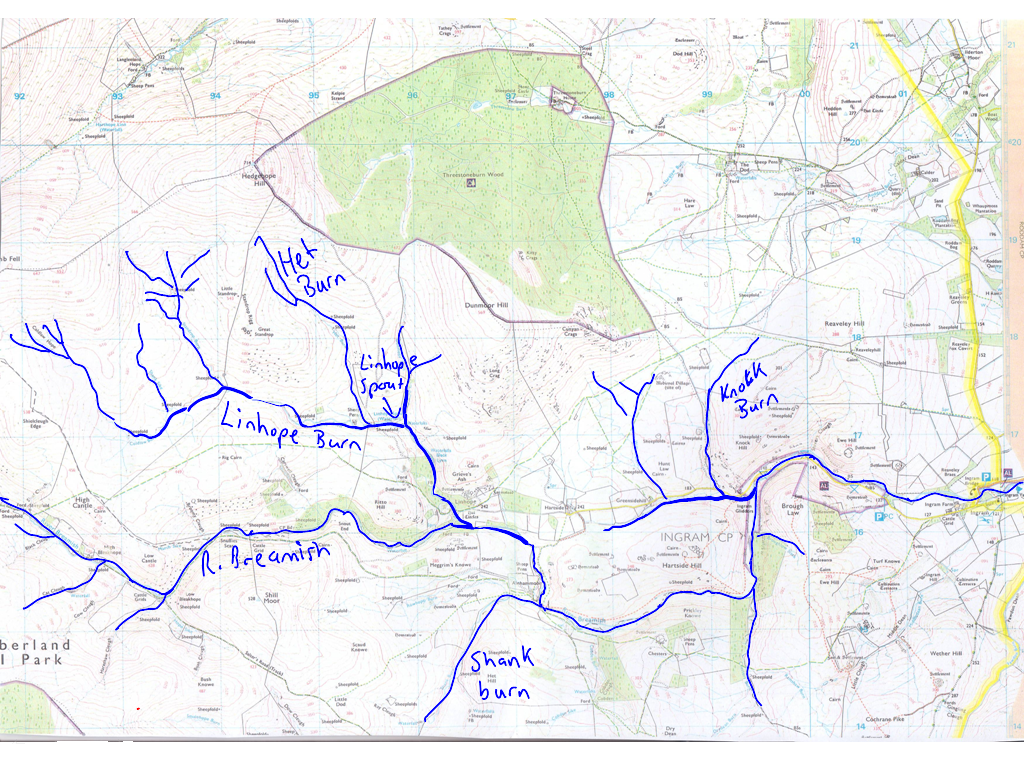
Research & Theory River channels effectively flow in drainage basins, and your task is to investigate the EROSION and DEPOSITION processes and evidence for these within those river channels. You could measure characteristics shown on the diagrams below. The Bradshaw model characteristics should be affected by erosion and deposition and erosion/deposition will be affected by some of those characteristics. Long and cross profiles will also indicate which erosion and deposition processes are opccurring along the River Breamish in Northumberland National Park |
|||||
 Click on the image for a larger clearer version of the Long Profile diagram above |
 |
||||
|
I have tried to collate all of the
relevant theory pages here. You can investigate more on Drainage Basins, Long and cross profiles here. For the erosion and deposition processes, you should explore the resources on this page. Useful documents The MARK SCHEME - How we will mark your work STUDENT version of mark scheme Evaluating the LOW CONTROL sections - self evaluation Location Get a map of the River Breamish from Ordnance Survey Links to a range of mapping resources A map of the River Breamish - add our data collection sites to it Watch a video - turn the sound right up OR use headphones
Method
|
|||||
 |
 |
||||
 |
 Click on the image for a bigger clearer version |
||||
|
Resources for graphing Blank spreadsheet to add your results to in data collation in class - 2013 version, I'll add the 2014 version AFTER your June fieldtrip - Right click and SAVE AS Long Profile Excel file to use with Ordnance Survey map Analysis An example of analysis on another topic - SAND DUNES - Watch a video of this - USE HEADPHONES to listen to the commentary |
|||||
|
2013 data collection sites View River Breamish study map in a larger map |
|||||

Photographs from the area, click on the photo to get a bigger, more refined image.
 Site 1 on Het Burn |
 V-shaped valley in the upper course of the Breamish |
 V-shaped valley in the upper course of the Breamish, on Linhope Burn |
 Typical bedload at site 1 on Het Burn |
 Bedload at site2 Near Linhope Spout |
 Bedload from site 1 - Het Burn |
 View towards site 2, below Linhope Spout waterfall |
 Site 1 on Het Burn |
 Confluence of Het Burn and Linhope Burn - near site 1 |
 Linhope Spout waterfall |
||
 Measuring stones with callipers |
 River Breamish close to site 4 |
 Measuring Velocity |
 Site 4 near a meander |
 |
 Site 7 on the river Breamish |
 Collecting bed load |
 |
 Depth |
 Width |
 Measuring stones |
 Velocity |
 The equipment used on the day
|
 Oranges in full flow! |
 A site in the middle reaches |
|
| PHOTOGRAPHS FROM 2015 | |||
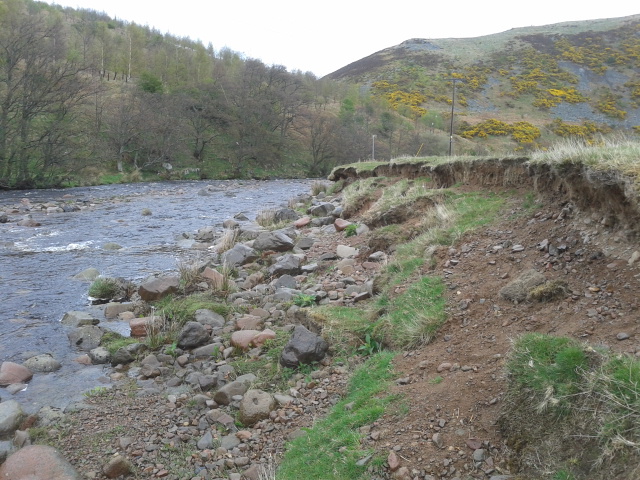 Bank erosion Downstream |
 Bank erosion next to car park |
 Bank sediment |
 Deposited bedlaod |
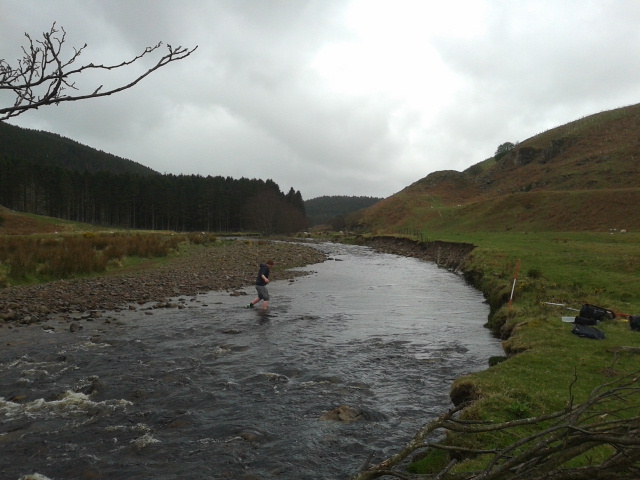 Site in middle reaches |
 Outside of a meander bend |
 Rock armour against outer bend erosion |
 Tributary valley |
 View of U-shaped valley |
 View of V-shaped valley |
 Plan view of U-shaped valley |
|
|
. How to use maps How to analyse graphs |
|||