|
|||||||||||||||||||||||||||||||||||||||||||||||||||||||||||||||||||||||||||||||||||||||||||||||||||||||||||||||||||||||||||||||||||||||||||||||||||||||||||||||||||||||||||||||||||||||||||||||||||||||||||||||||||||||||||||||||||||||||||||||||||||||||||||||||||||||||||||||||||||||||||||||||||||||||||||||||||||||||||||||||||||||||||||||||||||||||||||||||||||||||||
 |
 |
 |
|||||||||||||||||||||||||||||||||||||||||||||||||||||||||||||||||||||||||||||||||||||||||||||||||||||||||||||||||||||||||||||||||||||||||||||||||||||||||||||||||||||||||||||||||||||||||||||||||||||||||||||||||||||||||||||||||||||||||||||||||||||||||||||||||||||||||||||||||||||||||||||||||||||||||||||||||||||||||||||||||||||||||||||||||||||||||||||||||||||||||
|
Least developed Countries (LDCs) Countries at very low levels of economic development Try this data exercise on LDCs |
 |
||||||||||||||||||||||||||||||||||||||||||||||||||||||||||||||||||||||||||||||||||||||||||||||||||||||||||||||||||||||||||||||||||||||||||||||||||||||||||||||||||||||||||||||||||||||||||||||||||||||||||||||||||||||||||||||||||||||||||||||||||||||||||||||||||||||||||||||||||||||||||||||||||||||||||||||||||||||||||||||||||||||||||||||||||||||||||||||||||||||||||
|
Characteristics and
issues – quality of life, debt, social problems. Least developed
countries (LDC) are a group of very low income
countries identified by
the United
Nations (since 1971)
who are “confronting
severe structural impediments to sustainable
development”.
These problems include;
1.
Politics – a lack of political stability to allow for long
term planning, and/or a type of government that
is often non democratic, governed by a minority
and authoritarian in nature (such as a
dictatorship)
2.
Economic – Very low incomes (an annual figure of less than
$1,035 measured by GNI per capita) normally
measured over a three-year period.
A poorly DIVERSIFIED economy which makes
it
ECONOMICALLY VULNERABLE
(measured by an
Economic Vulnerability INDEX). This
is based upon/measured by the share of
manufacturing in the GDP (which for LDCs is
often LOW), the share of the labour force in
manufacturing industry (again LOW), the annual
per capita energy consumption and merchandise
export concentration levels (Low again). LDCs
often have economies dominated by the primary
industries.
3.
Social
– the population of these countries suffers from
Human resource weaknesses, such as low education
levels (using combined primary and secondary
school enrolment, literacy rates ) and literacy,
poor nutrition (see food supply issues on
DES-calorie intake per capita), and human health
(measured using life expectancy). This is
measured by a
HUMAN ASSETS INDEX.
4.
SOCIAL - Ongoing and widespread conflict is also a characteristic of LDCs
(including civil war and ethnic conflict, e.g.
Darfur in Sudan, or the current conflicts in
South Sudan and Iraq) whilst social
vulnerability can also be measured by the
percentage of the population displaced by
natural disasters and conflict.
So LDCs are
assessed using 3 measures related to these –
GNI, the Human Assets Index and Economic
Vulnerability Index.
The current list of LDCs includes
48 countries;
33 in Africa,
14 in Asia and the Pacific and 1 in Latin
America. 17 are
landlocked and 9 are small islands. These
countries include more than 880 million people
(approx. 12 per cent of world population), but
generate less than 2 percent of world GDP.
You can see more statistics here anon the LDCs and
explore
GIS data here.
Data for the LDCs;
The LDC countries
There are currently 48 countries designated by
the United Nations as least developed countries
(LDCs). These are shown on the map below
GRADUATION
Countries are assessed every 3 years and can “Graduate” out of LDC status
if they improve in the 3 areas above.
For example, LDCs have
an income below the threshold for inclusion as
an LDC with less than $1,035 GNI in the 2015
review. The threshold for graduation is set at
20 per cent above the inclusion threshold. It
will be $1,242 in the 2015 review. The countries
would also need to show they have improved in
the Human Assets index and economic
vulnerability index to graduate.
Some countries can graduate based only on income
(which enables a
country to be eligible for graduation even if
none of the other two criteria is met),
if they
double GNI beyond the normal graduation
threshold, set at $2,484 in the 2015 review.
Graduating countries include;
·
1975 - Sikkim which became a
state within the Republic of India in 1975
·
1994 - Botswana
·
2007 - Cape Verde
·
2011 - Maldives
·
2014 - Samoa
·
2017 –
Equatorial Guinea will Graduate
All of this means that
many of the people in LDCs live in poverty or
extreme poverty.
Extreme poverty is
defined by
the
United Nations in 1995 as “a condition
characterized by severe deprivation of basic
human needs, including food, safe drinking
water, sanitation facilities, health, shelter,
education and information”. Currently, extreme poverty widely refers to earning below
the international poverty line of a $1.25/day
(in 2005 prices), set by the World Bank. This
measure is the equivalent to earning a $1.00 a
day in 1996 US prices, hence the widely used
expression, living on “less than a dollar a
day”.
This has a huge impact on the quality of life that
people can live, and can result in a poverty
trap or cycle
Unfortunately poverty can lead to poverty.
The diagram shows the poverty trap, which
is often thought of as a cycle.
Low investment in key areas such as
infrastructure (roads, rail, telecommunications
etc.), education and healthcare can have dire
consequences for a population.
Populations in countries at low levels of
development can become more vulnerable to ill
health (as we have seen with HIV and AIDs in
sub-Saharan Africa) which reduces the
productivity of the workforce.
In addition, a lack of education leads to
a lower quality workforce, and poor road
networks are not attractive to outside
investors.
Simple things like these can exacerbate
(make worse) poverty, and keep countries mired
in a low level of development.
It is very difficult to expand from a very low base,
particularly in today’s very competitive global
economy.
In addition, countries at low levels of
economic development are also more likely to be
victims of civil wars and their after effects.
Countries such as the Sudan, Democratic
Republic of the Congo and Rwanda are good
examples of this.
Wars consume vital resources and divert
attention away from the crucial issues for
normal people, healthcare, reliable food
supplies, stability, economic well-being and
access to clean drinking water.
The world’s poorest countries have also been at the
mercy of a global trade system designed and
controlled by the world’s richest countries.
Several measures put in place by the
world’s richest countries mean that the world’s
poorest countries are at a disadvantage;
1.
Import tariffs of goods from poorer countries put the
prices of those goods UP
2.
Subsidies (payments from governments to the producer)
of goods produced in richer countries push the
prices of rich world goods cheaper. This makes
it harder for poorer countries to compete.
3.
The world trade system encourages a “race to the
bottom”, where buyers from richer countries go
from place to place around the world driving
down prices because supply of goods often
outstrips demand.
In addition, the lack of reliable energy supply,
political stability, infrastructure and educated
workforce put countries at a disadvantage.
The net result in many poorer countries
is that they are forced to export only lower
value raw materials such as agricultural goods,
whilst they buy back more expensive manufactured
goods or services.
Poorer countries do not have the capital
to set these types of industries up.
Paul Collier’s brilliant
work on “The Bottom Billion” is also well worth a look.
SOLUTIONS
However, those countries that are classified as
LDCs qualify for extra support such as;
1.
Overseas aid - aid to LDCs from
developed countries increased from $12.4 billion
in 2000 to $23.5 billion in 2004. 86% of this
was untied.
2.
Debt relief - Total debt burden for LDCs
increased to a record $158.9 billion in 2003, up
$20.8 billion from 2001. This is particularly
relevant to Heavily Indebted Poor Countries
(HIPCs). These countries INCLUDE MANY but not
all of the LDCs and
this group of 39 developing
countries are
eligible for special assistance from the International
Monetary Fund (IMF)
and the World
Bank.
3.
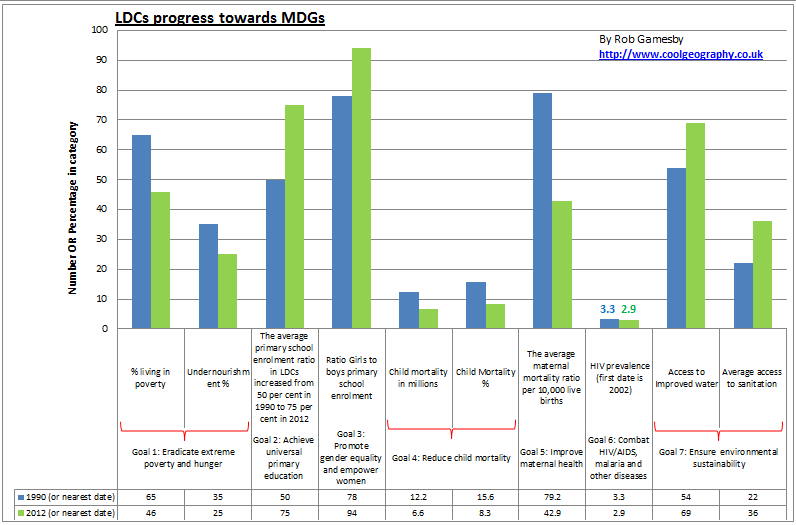
Millennium Development goals – LDCs have also
been helped by the MDGs listed below. The Millennium Development Goals (MDGs) were established
following a Summit of the United Nations in
2000. All of the then 189 United Nations member
states at the time and at least 23 international
organizations, committed to help achieve the
Goals by 2015.
Don’t forget that not all of these changes are
universal for ALL of the LDCs and despite
improvements there are significant VARIATIONS
between countries and also variations for
different groups of people WITHIN countries.
According to the UN “Most LDCs are off track
on the majority of MDGs”
and “… there is a marked
contrast between the performance of the Asian
LDCs, on the one hand, and that of the African LDCs and Haiti and
island LDCs, on the other.” Only
one Asian LDC (Yemen) is off track on most of
the targets, and one (Afghanistan) on half of
the targets for which data are available. The
Lao People’s Democratic Republic, uniquely among
LDCs, is on track to achieve all the seven goals
considered here, and the five other countries in
this group are on target for the majority of
them. Conversely, only one of
the seven island LDCs (Timor-Leste) is on track
on a majority of the targets. Of the 32 LDCs in
the Africa and Haiti group, only four (Ethiopia,
Malawi, Rwanda and Uganda) are on track for a
majority of the goals, while five are off track
on all the goals for which data are available
(the Democratic Republic of the Congo, Haiti,
Lesotho, Sierra Leone and Somalia).
|
|||||||||||||||||||||||||||||||||||||||||||||||||||||||||||||||||||||||||||||||||||||||||||||||||||||||||||||||||||||||||||||||||||||||||||||||||||||||||||||||||||||||||||||||||||||||||||||||||||||||||||||||||||||||||||||||||||||||||||||||||||||||||||||||||||||||||||||||||||||||||||||||||||||||||||||||||||||||||||||||||||||||||||||||||||||||||||||||||||||||||||