
|
|
||
| Back to Main Page | Back to GCSE Page | Back to Weather and Climate Menu |
Rainforest Photograph Interpretation
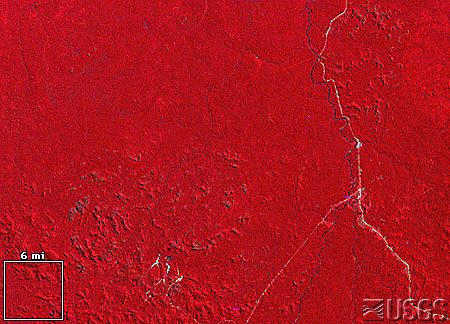
Rondônia, Brazil
1975, 1992
| 1975 | 1992 |
 |
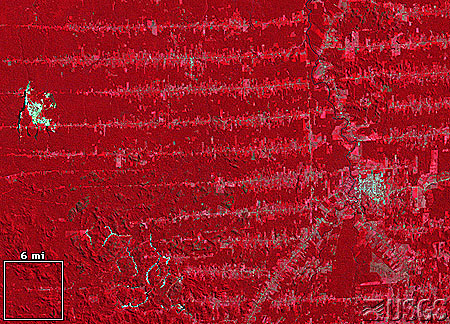 |
The images above show a portion rainforest in the state of Rondônia, Brazil. Healthy vegetation appears in Red, White areas show water and Blue/Green areas show bare ground.
Questions:
1) What has happened to the amount of bare ground in the area over time?
2) Describe the spatial pattern of bare ground in 1992.
3) Can you suggest reasons for this pattern? Answers
Approximately 30% (3,562,800 sq km) of the world's tropical forests are in Brazil. The estimated average deforestation rate from 1978 to 1988 was 15,000 sq km per year. Systematic cutting of the forest vegetation starts along roads and then fans out to create the "feather" or "fishbone" pattern shown in the Western half of the 1992 image. The deforested land and urban areas appear in light blue; healthy vegetation appears red.