|
|
|
| Back to Main Page | Back to Year 9 Page |
Year 9 Weathering and Lichens Study
 |
Project instructions Aims Introduction Method Graphing Concluding |
Resources - quick
links Information on weathering, rock types or Lichens Location map Data collection sheet Excel spreadsheet Weathering dance off video |
To explore the local landscape
To apply our knowledge of rocks, weathering and lichens to the local landscape
Your field work for year 9 is to investigate the extent of weathering
and the amount of lichens within a local graveyard. You will follow an
enquiry structure, where you must complete the following;
Introduction
In this section you need to give the reader of your study a good idea of what
your study is about and where it will take place. to do so you will need
to state
why you are doing the Study, mention where the study will take place
including a paragraph and some maps, include 2 questions you will answer and
some background information about weathering and lichens.
Watch the weathering dance off video here!
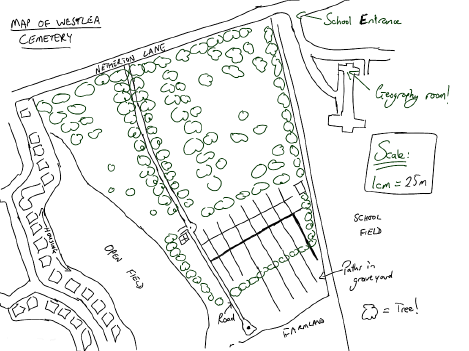
You can get some maps here, and you can find out more about the topic by clicking below;
| Weathering | Lichens | Rock types |
This section is all about stating and explaining how you collected the information you needed for your study.
You need to write about exactly how we collected our data whilst in the graveyard. To do so you will need to do the following;
1) Mention when we went to the grave yard, what the weather was like, where it is, and which headstones you sampled and why
2) Explain fully (with a clear description and reasons why) how we collected each of the following pieces of data:
•The stone type
•The extent of weathering on the stone
•The age of the stone
•The distance of the stone from the road
•Which side of the stone was weathered the most
•The coverage of lichens on the stone
3) How did we select the stones?
4) What problems and limitations are there to our methods? (what are the weaknesses in the way you collected your information?)
You can
download a copy of the data collection sheet here
and a copy of the Graveyard map here.
You will need to produce 2 graphs based upon the data you collected whilst in the graveyard. You could do this by hand or on Excel. You will need to ensure that your graphs are appropriate, well labelled and precise, have some originality and are well annotated? Use this spreadsheet to enter your data.
Analysis of graphs
Once you have produced your graphs you will need to write about them. Consider the following questions as you do this;
Do you describe the patterns on the graphs with examples and numbers?
Do you explain the patterns?
Do you account for any unusual results?
To finish off your investigation return to your title question and answer it as fully as possible. Then you need to state how you could improve the data collection and say how you could extend this study.